Category Archives: Projects

Last Lynching: Overview and Evaluation

The intellectual argument put forth by my project is based primarily on sources from the Texas State Library and Archives Commission.  The bulk of these sources were created through an investigation into the Texas Rangers by the Texas House and Senate. These sources were generated by powerful individuals (local representatives) who were viewing other individuals in power (state police force) with a critical eye.  While a plethora of recent scholarship has been produced about the misdeeds of the Rangers, scholarship that prioritizes the stories of the Rangers’ victims remains limited. My project seeks to acknowledge this imbalance by focusing on a single Ranger victim and the community involved in his story: Florencio Garcia. The presentation of Florencio’s story in my project asks users to consider the concepts of accountability, justice, and legislative reform.

Florencio’s story does not have an ending that fits in a nice, neat box. The Rangers that were widely believed to have killed him were required to testify in front of a joint committee, but they were never officially found guilty. The joint committee’s final report stated that the officers’ accounts were unsatisfactory. Is this what justice and  accountability looks like? A Mexican-American representative proposed legislation that would have implemented significant changes in the operations of the Rangers. His bill passed — but only after significant revisions that altered the bill’s content so much, the representative abstained from the final vote. Is this what reform looks like?

Florencio was one of many victims and survivors who were at the center of the Ranger investigation. I chose to focus on documents related solely to his story because of the questions his story raises. Additionally, I believe the examination of the victims’ stories on a case-by-case basis serves to return a small portion of power and dignity to individuals who had much forcibly taken from them.

Moving forward, evaluation will be vital to the success of this project. A committee of at least 10 individuals should be compiled to review and test content before the project is officially launched. I saw a lot of merit in the user experience rubric proposed by Craig MacDonald; that will likely be incorporated into the first evaluation period. Evaluations will be held at regular intervals and at critical moments in the project’s lifecycle. In addition to a pre-launch evaluation, an evaluation will be held concurrently during the project launch and 6 months out from the launch date. Evaluations will be facilitated using a combination of interviews and respond-and-return questionnaires with stakeholders, users, and members of the target audience. Both formats (interview and respond-and-return) will collect qualitative and quantitative data.
Project Progress Update #4

I was able to add a few more events to the timeline this week. My goals for the next week are to get all the necessary content into the timeline and to flesh out the exhibit pages more. Once that is done, I will need to take a critical eye to all of the text that has been produced to ensure that it meets the stylistic standards I’d like to meet. I will also need to create and figure out a location for a Bibliography page. I think it should definitely have it’s own section within the exhibit, but I’m considering also including a link to that page in the navigation bar.

Project Progress Update #3

Since my last update, I’ve added three new pages to my navigation bar: Contact, Community Contributions, and Español.

The addition of a contact page was pretty straightforward. Omeka offers a contact form plugin, so I installed that and set it up. The plugin recommended I enter reCAPTCHA site keys under my “Settings” section to avoid spam submissions. Signing up for reCAPTCHA keys through Google was a quick and painless process.

The “Community Contributions” page took a little more thought, however. Omeka does have a Contributions plugin, but I was hesitant to utilize that. The way I envisioned the “Community Contributions” page was more akin to a permanent exhibit at an art museum — patrons can view the art on display, create meaning from that experience, but the museum will not accept unsolicited creations from visitors to display alongside the permanent pieces. The curation process for that specific permanent exhibit is not ongoing: it happens only during a specific timeframe determined well in advance by museum staff. Because of this, I decided not to pursue the Contributions plugin. Instead, I experimented with the Exhibits and Collections functions of Omeka, the idea being that each contribution would be input into Omeka as an item. However, I wasn’t a huge fan of the layouts these tools provided.

I was looking for a gallery-type display of the files associated with the items, that linked back to the items themselves. I settled on creating a SimplePage and entered a shortcode in the text box that would return all items tagged “communitycontributions”. In the page description, I also included a link to the Contact page along with the following text: “Have a question about how we accept and display community contributions? Send us a message here.” I’m still contemplating what the curation policy for this page should be — perhaps once or twice a year submissions could be accepted and the content refreshed. Regardless, once the policy is determined, information about it can be posted on this page.

Finally, I added an Español page. Ideally, when a user clicked this button, they would be transported to a twin site where all the pages were in Spanish (this seems to be the case with the Bracero History Archive). Better yet, the translation would somehow be ingrained into the site and users wouldn’t need to be redirected to a separate link (as is the case with some of the pages on New Roots).  Unfortunately, I think this would take a bit more time for me to figure out, so I settled for a SimplePage duplication of the homepage. It’s not as clean as I would like it (I can’t figure out how to translate the buttons in the navigation bar or the name of the website), but it gets the job done. I’d like to fully translate the home page, including the timeline in its entirety, but that may be too lofty of a goal – only time will tell.

Project Progress Update #2

This week, I experimented with and settled on a solution for the timeline element on the homepage. I selected Timeline JS from Knightlab because of its simplicity and accompanying tutorials. Additionally, I was able to include an element in the timeline that I considered very important — the ability to hyperlink directly to certain exhibit pages. The inclusion of a “Read More” link in each timeline event will allow users to go straight to the event that they’d like to learn about most. To me, this is important because I don’t want users to get lost while navigating the website or feel like they need to do an extensive amount of digging in order to answer their most basic questions.

One drawback to this method, however, is that clicking on the “Read More” link opens up a new tab. Instead of redirecting the already open tab to the linked exhibit page, the already open tab remains on the homepage and a new tab opens to display the linked exhibit page. This isn’t a major problem, it just feels a bit clunky. From what I’ve learned about Timeline JS, this issue doesn’t have a solution, or at least not a straightforward one. Since the tool is an external one that has simply been embedded into the Omeka/Wordpress site, it makes sense that it wouldn’t be able to reroute the existing tab to a different internal page. It’s not what I had in mind, but users should still be able to find their way around the site once on the rerouted new tab.

The issue of the permanent navigation bar at the top of the page was solved through the selection of a different Omeka theme – Foundation. This theme includes the option of a horizontal dropdown navigational layout that is visible at the top of every page on the site. It includes a search bar and it’s easy to add new links to the bar through the navigation section under appearance. The installation process for the theme took a little more time than anticipated — I was unsure how to upload the unzipped theme folders into my cPanel as a bulk action, so I had to upload them all individually. I believe I will need to utilize this same method when I install the Simple Contact Form plugin.

At this point, the website and most of the elements are very bare bones. My goals up to this point have been to create basic pages and ensure that it was feasible for me to include the elements that I had prioritized. Now I will need to begin filling in the blanks and ensuring that the pages look closer and closer to the finished product. For the next week, I’ll focus these efforts on the homepage and the timeline.


Project Progress Update #1

My main focus right now is on the timeline element I’d like to feature on the homepage. There are a number of different tools I could use to create a timeline: the Neatline plugin through Omeka, Timeline JS from Knightlab, Tiki Toki, etc. I also need to figure out how to add in a permanent navigation bar at the top of the page and build out the pages that the links on that bar would navigate to (ex: Community Contributions, Contact). Finally, I’d like to reformat the landing page for the exhibit (“The Lynching”) so that it’s more in line with my paper prototype.

Project Proposal: The Last Lynching of Cameron County

“The Last Lynching of Cameron County” website will present information about the lynching of Florencio Garcia, the last confirmed lynching victim in Cameron County, Texas. Florencio’s story is unique because his death was classified as a murder, not by a grand jury, but rather by an investigative committee for the Texas House and Senate. Even as state senators and representatives declared Florencio’s killing unlawful, they took no action to bring his suspected killers (two Texas Ranger officers) to justice.

The intended audience for this digital history project are individuals with a connection to or interest in the Rio Grande Valley region (specifically Cameron County and the city of Brownsville), the Texas Rangers, and/or a history of anti-Mexican violence. The hyper-specific scope of this project will probably mean that the individuals who are most likely to engage with the end product will be current citizens of Cameron County, Hispanic (most likely of Mexican heritage), Spanish-speakers, and have some college education. Other characteristics of likely users include: an interest in history, involvement in local community organizations, politically aware and active, a desire to draw connections between current events and the past, and individuals who are interested in elevating untold/under told stories.

Project Goals

  • Present an easy-to-access narrative of Florencio Garcia’s lynching. Include opportunities for more advanced users to further explore the people and events surrounding Florencio’s story if they wish. These opportunities should be accessible, without overwhelming those users who do not wish to engage beyond Florencio’s basic story.
  • Provide a dedicated space/time for users to share their thoughts and opinions on Florencio’s story, the history of violence and discrimination in the Rio Grande, and the current relationship law enforcement has with its local and state communities.
  • Inspire users to reflect on the following questions:
    • How did non-Anglos understand and respond to Florencio’s disappearance and murder?
    • What impact did Florencio’s lynching and the resulting investigation into the Texas Rangers have on the local community?
    • What impact did his lynching  have beyond the Rio Grande Valley?
    • In what ways does Florencio’s story inform the way locals understand present-day events in the Rio Grande?

A unique challenge with this project will be reconciling the available historical content with the goal to present Florencio’s story in a narrative format. Photographs, images, physical objects, and biographical information are essential to a captivating story. Unfortunately, Florencio left a very limited amount of this information behind, likely for the same reasons that made him a target to begin with. It’s likely that the powerful groups that decided what was incorporated into the historical record in the early 20th century did not see much value in maintaining information about a young Mexican national who worked as a cattle herder. Because of this, content may need to come from sources that have no direct connection with Florencio, but present experiences of people whose life experiences were similar to his. A heavy amount of information will need to come from newspaper articles and government documents, like the Proceedings of the Joint Committee of the Senate and the House in the Investigation of the Texas State Ranger Force, 1919.

The technological elements of the website should allow users to easily submit feedback and view the feedback of other users. The internet being what it is, this talk-back space will need to have a delay built into it, so that project admins can review user-generated content before it is made public. Omeka might be a good fit for the needs of this project.

Mapping Central Texas Lynchings: Project Creation

Project URL: http://stephanietmartinez.com/projects/mappingcentraltexaslynchings/

This project aimed to visualize a list of known lynchings in central Texas in order to reveal previously unseen patterns and stimulate new questions. It also aimed to fill a gap that exists regarding this sort of visualization – numerous lynching visualizations exist regarding the US and Texas, but none that I am aware of displays to great extent the lynchings in the central Texas region.

Before I began my work on this project, I anticipated that the presentation of data would make an overwhelmingly strong case supporting the history of racialized lynching in the region. Once the map was created though, I noticed that more than half of the lynching victims were white. It occurred to me that someone viewing and using the map might conclude that race was not a major contributing factor to these lynchings since more white victims were lynched than non-whites. I don’t believe this to be the case, but it might be a good idea to include more context with the project to support this theory. I think in future iterations of this project, I’d like to create an exhibit with Omeka based on this topic and incorporate this map into that larger project. I’d also really like to find a way to include county borders on the map.

I used information from Appendix A in The Making of a Lynching Culture: Violence and Vigilantism in Central Texas, 1836-1916 by William Carrigan. I selected this material because because it contains a comprehensive list of more than 100 lynchings in the area over a span of less than 100 years, along with county locations. I used kepler.gl to easily map and visualize the locations of the lynchings. I really admire the filters kepler.gl offers in its demo version.

I really wanted the user to reflect on the race of the lynching victims, so I made it the default view by color-coding the points. I could have chosen to make all the points the same color and then allowed users to filter the points by race. I also could have added multiple layers (of the same data) and then filtered the data by race so that a layer displaying white/Black/Mexican victims could more easily be made visible or not visible based on the users preference. In the end, I decided that I wanted to make it relatively difficult to “turn off” the option to view points by race, which is why I only included one layer of data with color coded points. I am unsure whether a DH project should reflect the perspective of the creator or should be as close to a blank slate as possible. I wouldn’t necessarily categorize this as a problem – just food for thought and something to take into consideration as I move forward with DH.

I saw an opportunity to use OCR when entering the information from Carrigan’s book into an excel spreadsheet, so I did that. I then had to review and correct the OCR entries. The entire OCR process took much longer than anticipated. I then determined basic geographic coordinates for each county, and used a random location generator to create modified coordinates for each lynching so the points wouldn’t display on top of each other on the map (which would result in only a handful of points on the map instead of 100+). I also modified the alleged crime categories so they would be a bit more uniform to make that category easier to work with in the filter function (example: combining “horse theft” and “cattle theft” into “theft, horse/cattle”). Finally I uploaded the csv spreadsheet to kepler.gl, adjusted the settings of the map, and embedded the map in my post.

I was really shocked by how much time was spent in what felt like “prep” work: scanning the text, using OCR, prepping the spreadsheet, finding coordinates that would display appropriately on the map, etc. Compared to that, the actual work with the map and the post felt like a breeze. There were some creative decisions that had to be made when adjusting the settings on the map that I had not extensively considered beforehand. Overall, there was a lot of trial and error involved in the process.

Mapping Central Texas Lynchings, 1860-1922

This map was created using information from Appendix A in The Making of a Lynching Culture: Violence and Vigilantism in Central Texas, 1836-1916 by William Carrigan. To view and interact with this map in full screen mode, click the following link: CTX Lynchings.

This project maps the lynchings of more than 100 individuals in 7 different counties in the central Texas region. The database this project was based around includes a combination of white, Mexican, Black, male, and female victims. Points on the map are color-coded based on the race of the victim and represent the general location of where a victim was lynched. Unfortunately, exact locations could not be found for most lynchings in the database, so random geographic coordinates were generated inside the boundaries of the county where the lynching occurred.

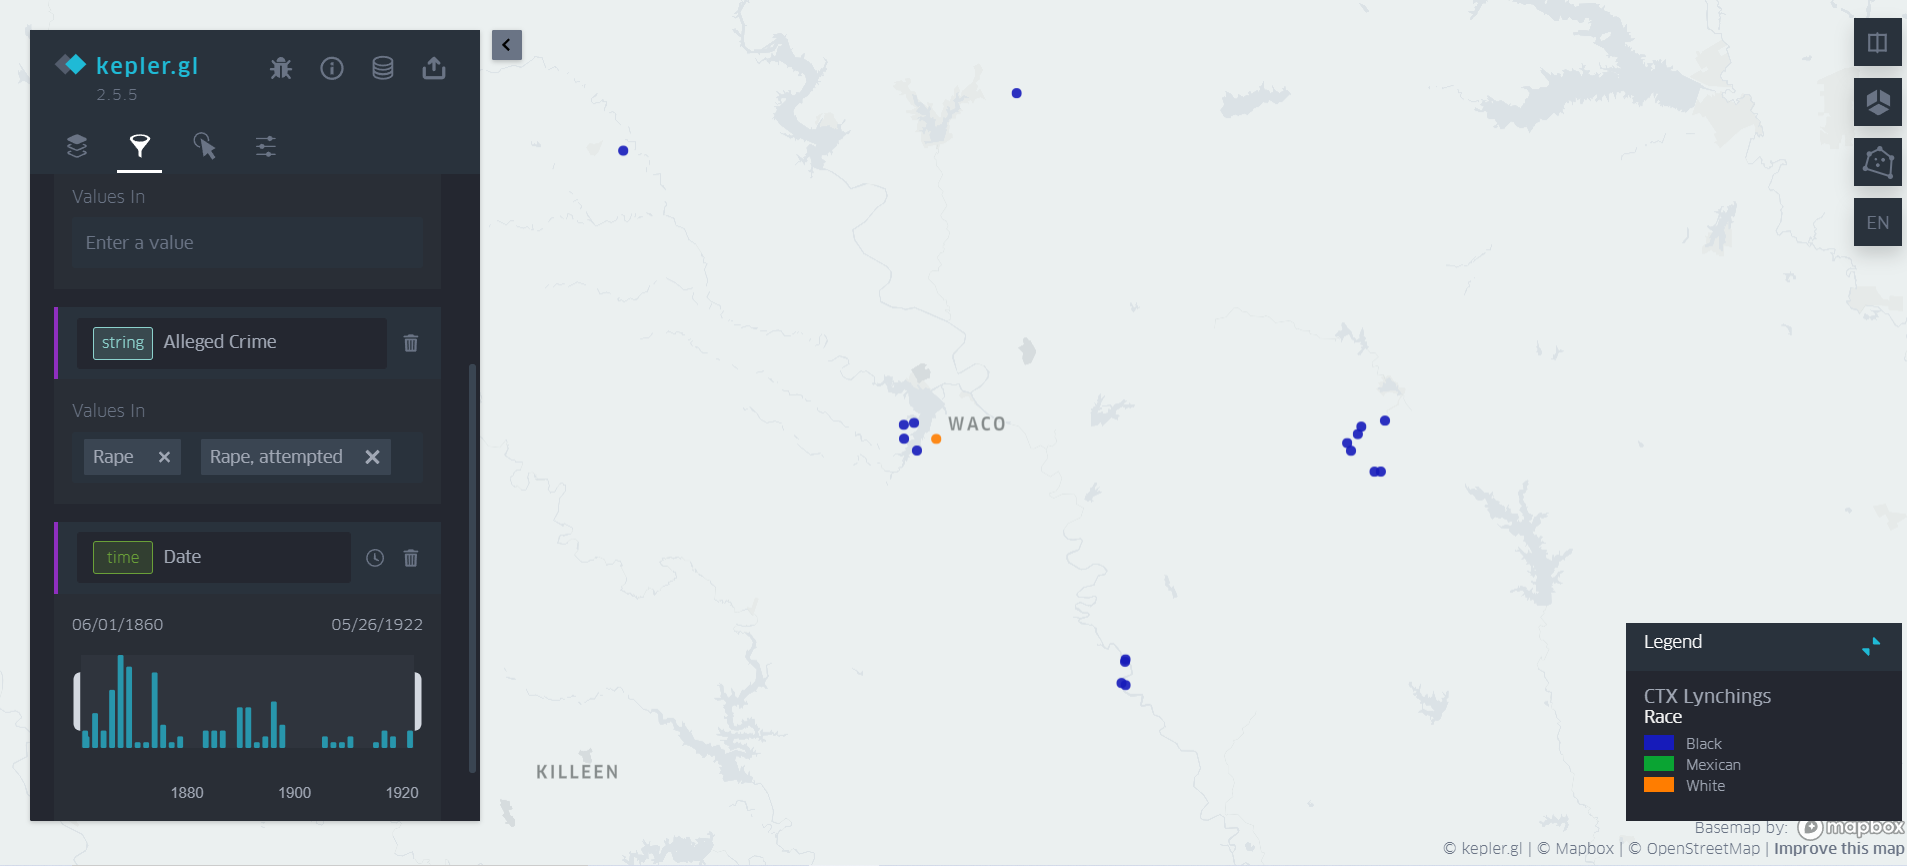
Users can quickly visualize the distribution of lynchings across central Texas. Further analysis can be conducted using the “Filters” function in kepler.gl; users can display lynchings based on the victim’s alleged crime, race, and the day they were lynched. The “Filters” function is extremely helpful in allowing users to view potential trends in the data. (See screenshots included below for examples.)

Screenshot of Central Texas Lynchings map with the alleged crime filter displaying victims who were lynched for rape and attempted rape.
Screenshot of the Central Texas Lynchings map with the alleged crime filter displaying victims who were lynched for rape and attempted rape. The blue points are Black victims, the orange points are white victims.
Screenshot of Central Texas Lynchings map with the alleged crime filter displaying victims who were lynched horse or cattle theft.
Screenshot of the Central Texas Lynchings map with the alleged crime filter displaying victims who were lynched for horse or cattle theft. The blue points are Black victims, the orange points are white victims.


Three white victims that were included in the Carrigan database were not included on the map. The names of these individuals are unknown and the locations of their lynchings are listed only as “Central Texas.” All three were hanged by a mob consisting of citizens from Coryell, Hamilton, Bosque, Comanche, and McLennan counties, and their alleged crime is listed as murder and cattle theft. They were killed on April 1, 1861.

This project is not the first to map lynching victims in central Texas. Lynching in Texas from Sam Houston State University uses Omeka and CartoDB to present information about lynchings across the state. Unfortunately, the CartoDB map is a little difficult to maneuver and doesn’t allow for easy exploration or filtration of data. The Equal Justice Initiative’s Lynching in America map is very visually striking, but doesn’t include information on lynchings of non-Blacks and doesn’t allow users to view a list of victims by county.

The creation of this map also corresponds with a significant upcoming event in Central Texas. Next year, the Texas Historical Commission and the City of Waco are slated to install a historical marker commemorating the lynching of Jesse Washington and the overall culture of lynching in the region. Hopefully this project can aid in the general understanding of these events as the central Texas community works to understand and memorialize the murder of more than 100 individuals.